Education

Infogram lets students and educators alike easily create charts, maps and infographics for free. Learn how Infogram can boost data literacy in the classroom.

Start your first project
image

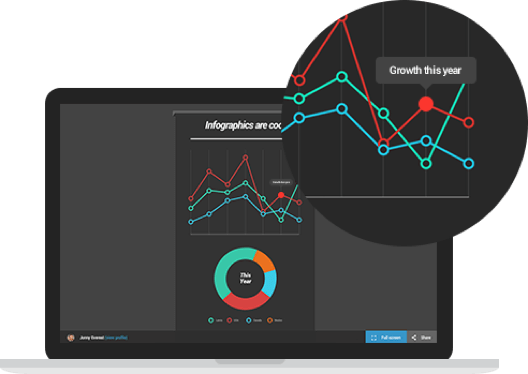
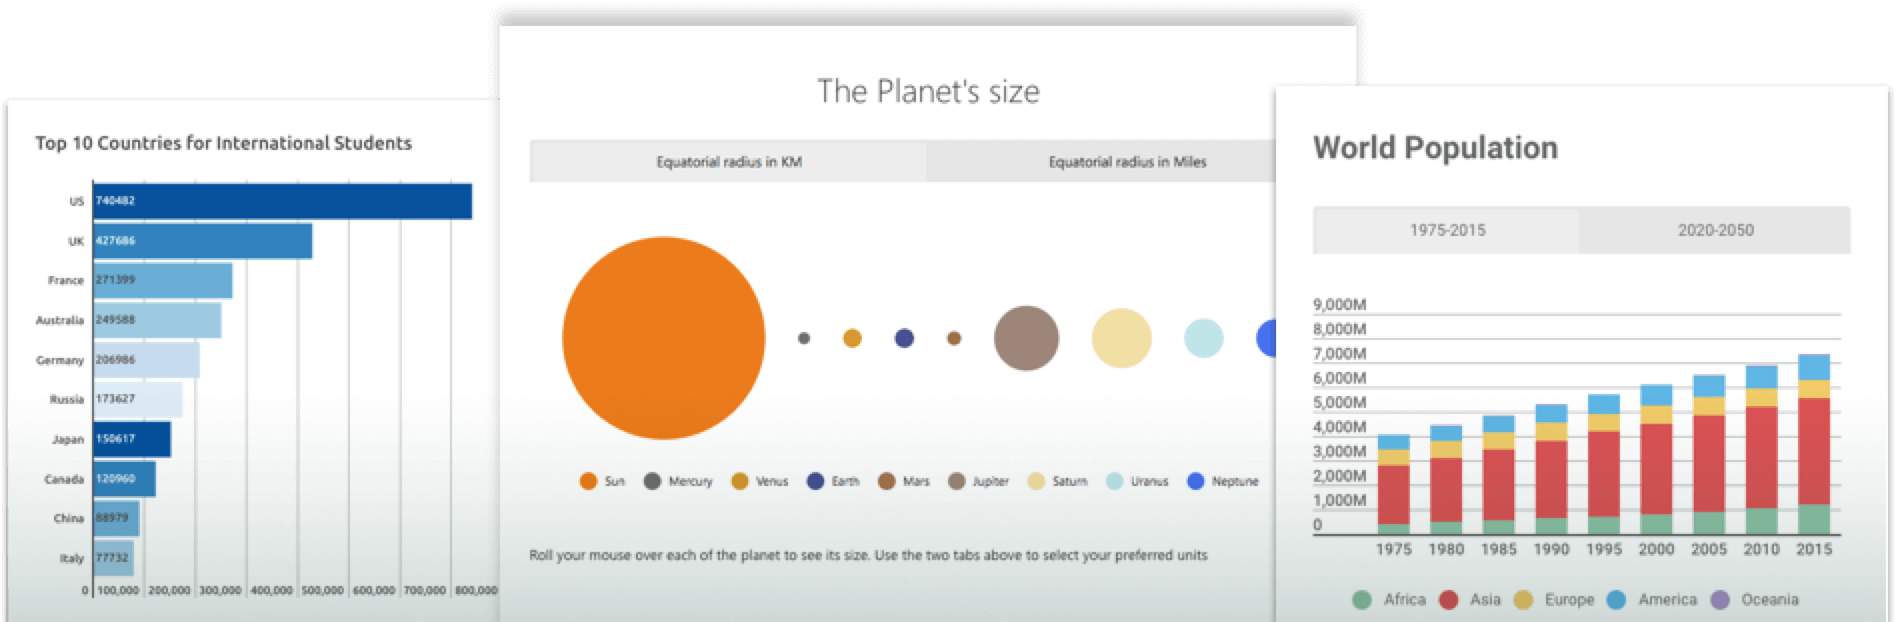
Encourage students to get involved in the classroom with Infogram’s interactive charts and infographics.

Schedule a demo

It doesn’t matter if you’re an individual student or large academic organization, we offer special educational pricing to meet your needs.

Contact Us

Everybody Love Infogram

Here's what our customers have to say about us.

“Infogram is a great service to make impactful charts and maps, and easily bring life to a story in a few clicks.”

William Cuthbertson, University of Northern Colorado

“Infogram's interactive charts can double the engagement on a page“

Elizabeth Kahn, Patrick F. Taylor Science & Tech Academy

Elizabeth Kahn, Patrick F. Taylor Science & Tech Academy

image

Data Literacy

Like reading and writing, data literacy is a key skill to have in the 21st century. Teach your students how to better understand data and tell data-driven stories with Infogram.

See Examples

Built for the Classroom

image

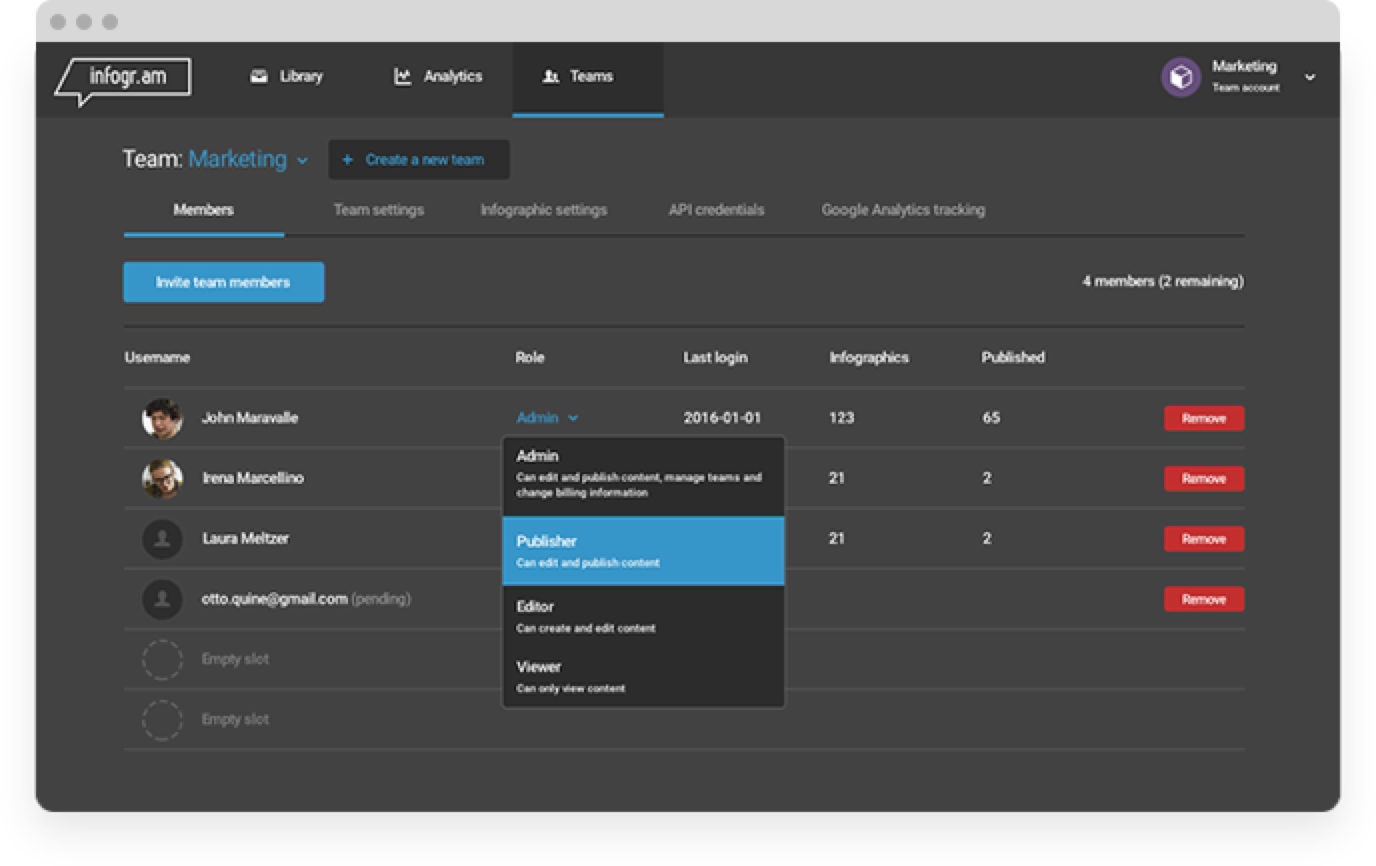
Infogram is built for collaboration. Create a team account for the entire class and invite students. For simplicity, students can log in with their Google and social media accounts.

Contact Us

“With Infogram, Zephyr is able to create neighborhood specific mailings with data and charts in an afternoon instead of a week.”

– Melody Foster, VP of Marketing at Zephyr

Read story

“Everyone from reporters to producers to graphics people use Infogram to create charts and visualizations.”

– Matt Martel, Executive Editor at Fairfax Media

Read story

“We wanted to create good content in a nice visual way, with a lot of design – but fast! We started using Infogram because of that.”

– Wagner Faria de Oliveira, Researcher

Read story

“At GTB we pride ourselves on creating content which engages, so it’s critical we understand the impact of our work. With the simplicity of Infogram we can create reports with all the detail we need while being easy to read and quick to create.”

– Fabrizio Rinaldi, Social Media Director

Read story

“Our researchers are very data driven but also visual. With Infogram, for each finding and dataset, we were able to quickly test different visualizations and then choose the best option. We were able to quickly in a very agile manner develop the look and feel of our graphs.”

– Andreas Oszkiel, Operations Manager

Read story

Used by many great companies, including: