Empowering government organizations

Infogram helps government organizations communicate and share data in a way that is effective and powerful. Engage citizens with interactive content and beautiful reports, maps and infographics

Start Now
image

Communicate better with data

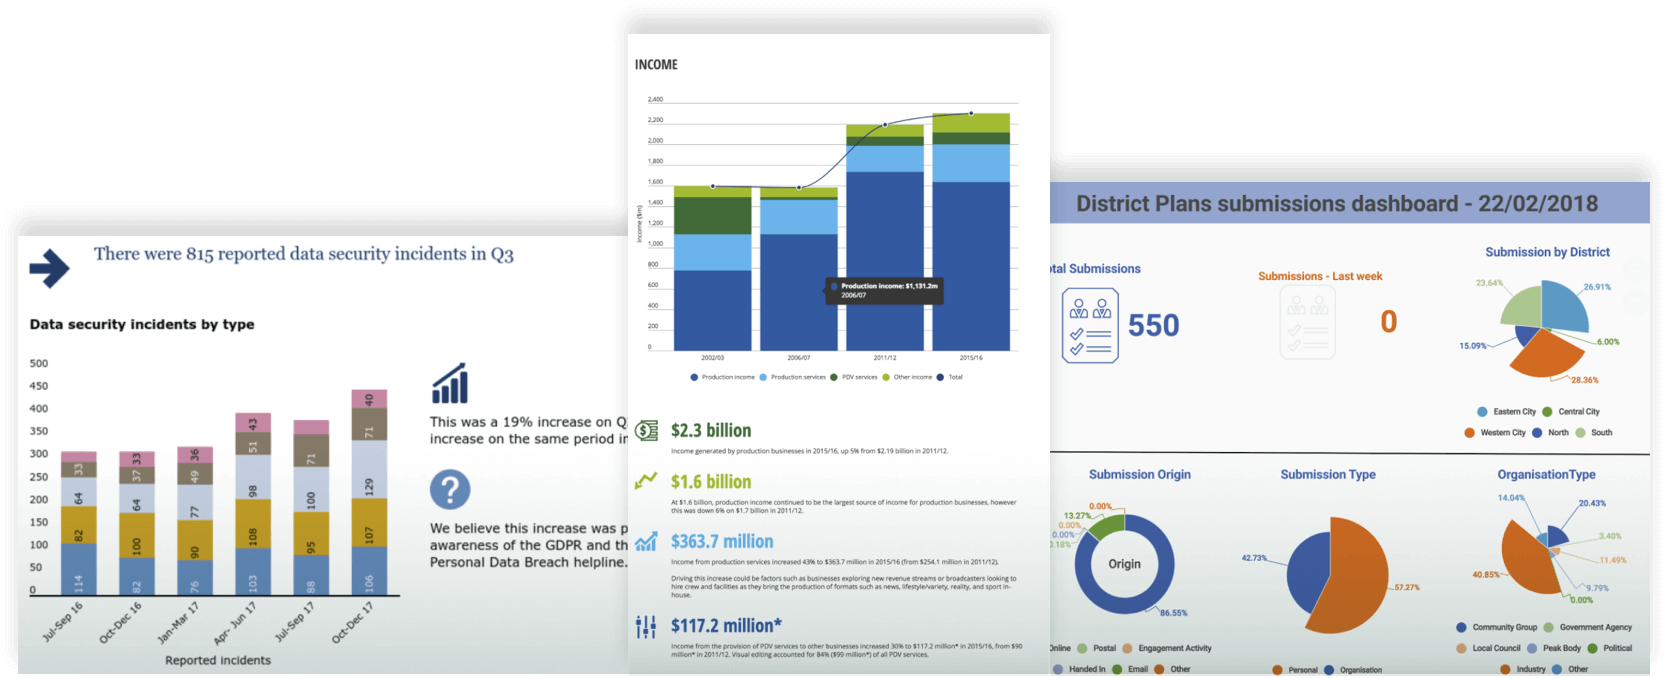
Government institutions produce essential data on everything including economic trends, public spending and funding projects. Infogram turns your data into compelling visual stories that engage the public and build trust.

We’re here to help. Meet an Infogram expert that will answer your questions and show you what you can achieve with Infogram.

Schedule a demo

Everybody Love Infogram

Here's what our customers have to say about us.

“Employment Service of Slovenia (ESS) uses Infogram with the aim to present relevant data on unemployment and employment trends to the general public and media. Infogram enables data visualisation, which has made our reports and websites more user friendly and attractive for readers. What we value most is the responsiveness of the support team which is highly committed to solve any potential user difficulties.”

Tjaša Žakelj, Employment Service of Slovenia

Tjaša Žakelj, Employment Service of Slovenia

“With Infogram we have found a tool that makes it easy to communicate facts and numbers through infographics and charts. And it’s easy to use. It’s been a great return on investment”

Alan Nyhus, Danmarks Naturfredningsforening

Alan Nyhus, Danmarks Naturfredningsforening

Boost your communication efforts

Meaningful visuals help you share your mission with the public across multiple communication channels.

90% Spend more time on page with interactive charts and infographics
34% More shares with stunning data visualizations
Maintain brand consistency
Keep design consistent with themes and templates that match your brand's colors, fonts, and style guidelines. Branded projects can be repurposed, copied, and reused - which saves time.
Share visual insights with the public
Infogram offers a variety of project types: infographics, reports, individual charts, maps, and social media assets that make it easy to share government data in a visually appealing way.
Optimized for mobile
Infogram uses state-of-the-art technologies to offer the best possible experience for the web and mobile devices.
Publish your content easily
Our charts can easily be added to AMP (Accelerated Mobile Pages), Medium Stories and any CMS (Content Management System). We also have an Infogram’s WordPress plugin
Compliant with the Web Content Accessibility Guidelines (WCAG 2.0)
This means people with disabilities like vision impairment, limited movement, and cognitive limitations can read, understand, and navigate through our visual content. Now you can make sure that everyone sees your message, while helping to make the Internet a more inclusive, fair, and equal opportunity digital ecosystem.

Built for government and public organizations

image

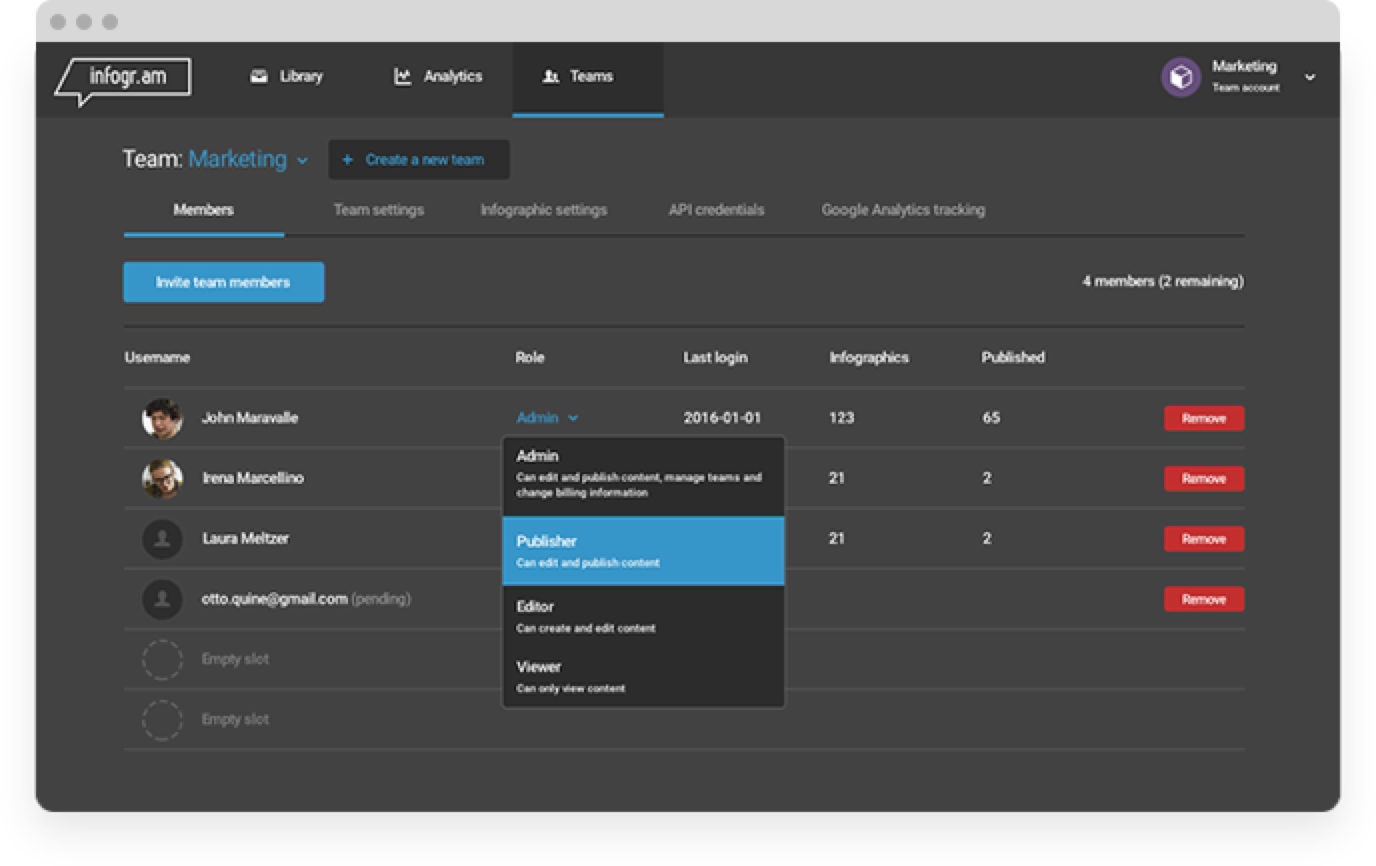
Infogram is built to help teams work faster and share complex ideas in a way that is beautiful and impactful. Express your vision and strengthen your relationship with the public using data.

Contact Us

“With Infogram, Zephyr is able to create neighborhood specific mailings with data and charts in an afternoon instead of a week.”

– Melody Foster, VP of Marketing at Zephyr

Read story

“Everyone from reporters to producers to graphics people use Infogram to create charts and visualizations.”

– Matt Martel, Executive Editor at Fairfax Media

Read story

“We wanted to create good content in a nice visual way, with a lot of design – but fast! We started using Infogram because of that.”

– Wagner Faria de Oliveira, Researcher

Read story

“At GTB we pride ourselves on creating content which engages, so it’s critical we understand the impact of our work. With the simplicity of Infogram we can create reports with all the detail we need while being easy to read and quick to create.”

– Fabrizio Rinaldi, Social Media Director

Read story

“Our researchers are very data driven but also visual. With Infogram, for each finding and dataset, we were able to quickly test different visualizations and then choose the best option. We were able to quickly in a very agile manner develop the look and feel of our graphs.”

– Andreas Oszkiel, Operations Manager

Read story

Used by many great organizations, including: