Empowering Editorial Teams
Infogram makes it easier to communicate data and complex ideas in an engaging and memorable way. Our charts and infographics are fully responsive, which means they look great on mobile and screens of any size.
Infogram makes it easier to communicate data and complex ideas in an engaging and memorable way. Our charts and infographics are fully responsive, which means they look great on mobile and screens of any size.
An Infogram expert will answer your questions, show you a demo, and set you up with a free trial.
Schedule a demo Infogram
“Infogram is a great service to make impactful charts and maps, and easily bring life to a story in a few clicks.”

Thomas Seymat, Euronews
@tseymat“Infogram's interactive charts can double the engagement on a page“

Matt Martel, Fairfax Media
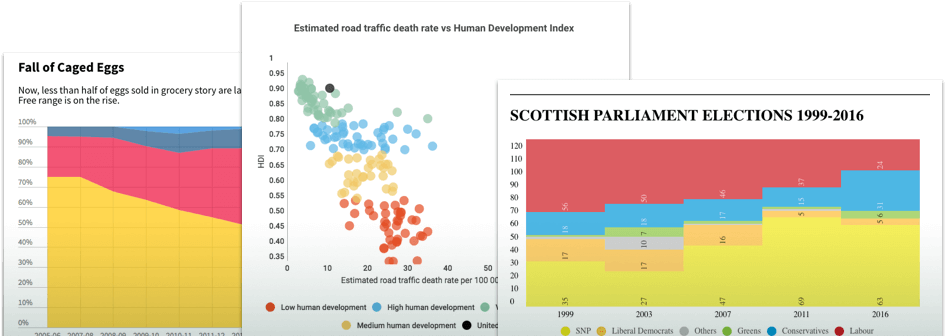
@matt_martelCharts and infographics are shared more than any other type of visuals online. Embed interactive visualizations and animated GIFs to create addictive, shareable content.
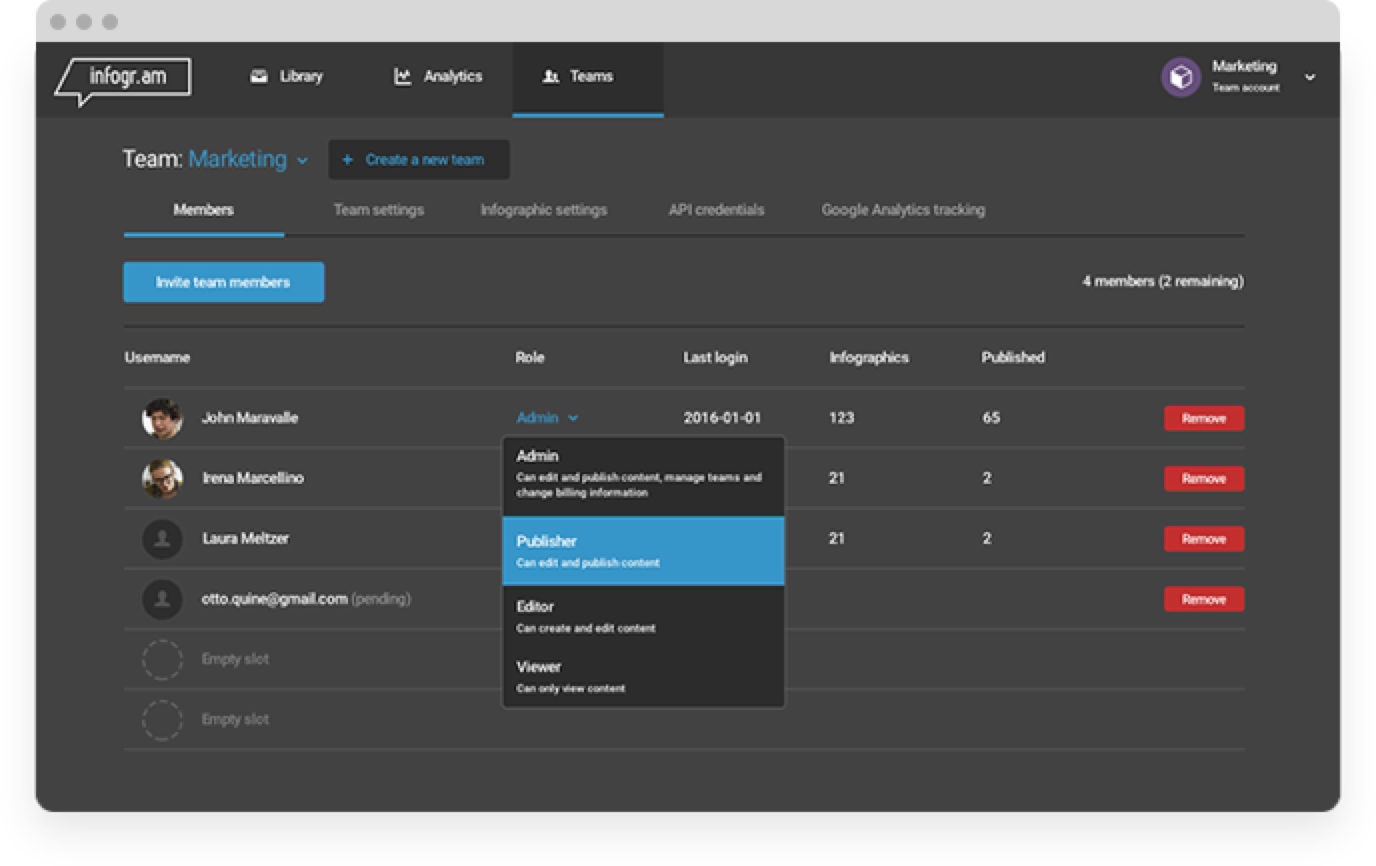
Infogram is built for collaboration. Create a team account for the entire newsroom or individual journalists. Invite team members to edit projects and share folders for content that is consistent and professional.
Contact Us