Reporting

Infogram gives busy professionals the ability to create impressive charts, reports and dashboards in minutes. Learn how Infogram can help you present data and stand out from the crowd.

Start Now
image

Make Reports and Dashboards That People Will Love

Use Infogram to quickly communicate complex ideas in a visually engaging way. With Infogram you can share key metrics, business projections, and company goals.

An Infogram expert will answer your questions, show you a demo, and set you up with a free trial.

Schedule a demo

Everybody Love Infogram

Here's what our customers have to say about us.

With Infogram we turned our reporting into the cutting-edge category and receive amazing feedback from the user community.

Andreas Igler, Warner Music

Andreas Igler, Warner Music

At GTB we pride ourselves on creating content which engages, so it’s critical we understand the impact of our work. With the simplicity of Infogram we can create reports with all the detail we need while being easy to read and quick to create.

Fabrizio Rinaldi, GTB

Fabrizio Rinaldi, GTB

Transform Data into Persuasive Visual Presentations

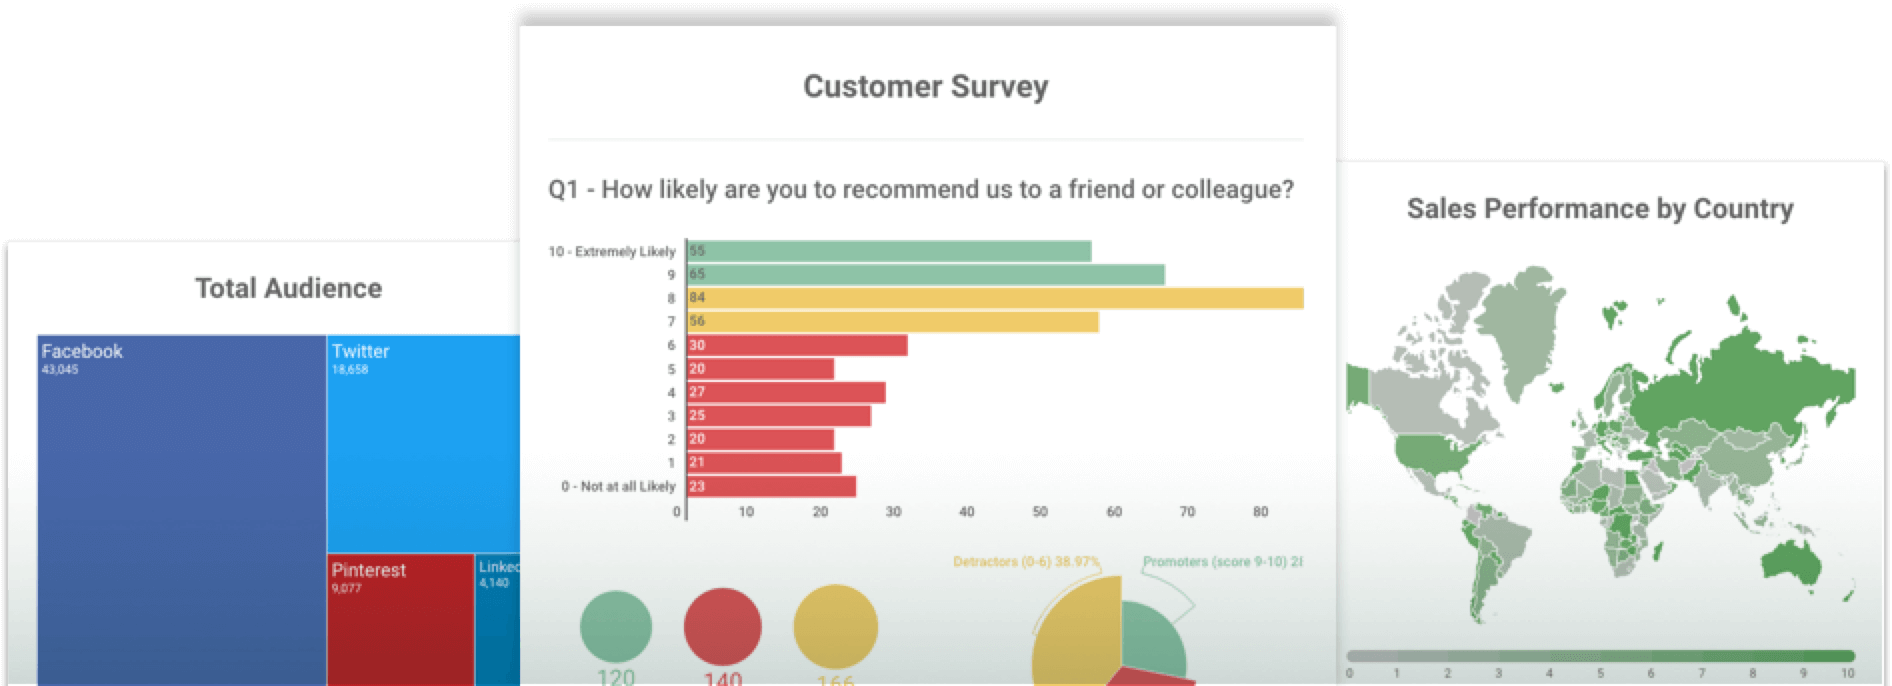
Use charts to grab your audience’s attention and leave behind a lasting impression. Increase engagement and educate your viewers with Infogram.

90% People spend more time on pages with interactive charts and infographics
34% Social media posts with infographics get more shares and likes
Your brand and style
Take complete control over the look of your charts with custom-designed themes featuring your brand’s colors, fonts and logo.
Live data feeds
Connect live, real-time data to your visualization projects for up-to-the-minute updates. Embedded charts and infographics stay current, no manual work required.

Built for Productive Teams

image

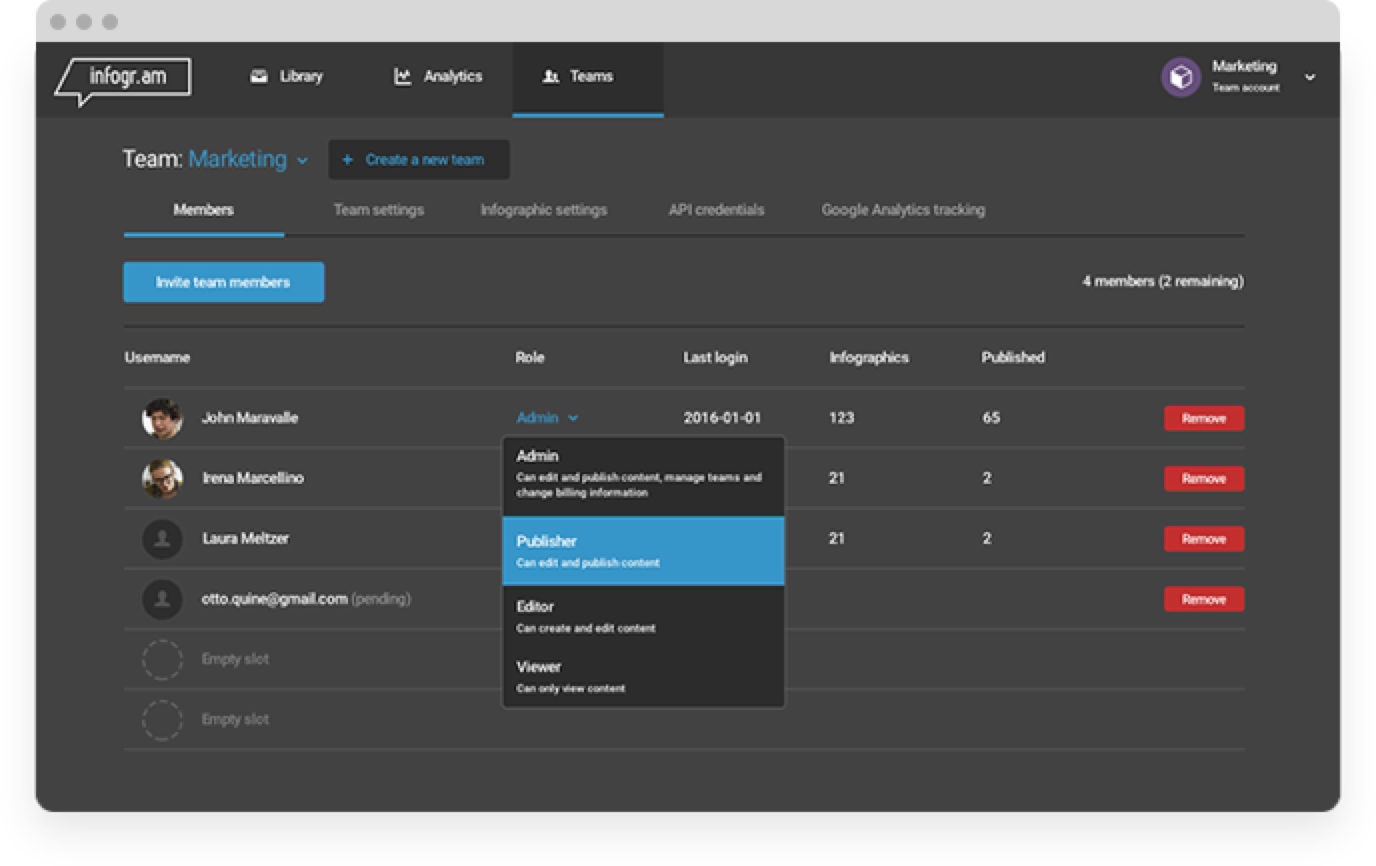
Infogram is built for collaboration. Invite your team members to edit your projects, share folders, define access permissions and create more great content than ever before.

Contact Us

“With Infogram, Zephyr is able to create neighborhood specific mailings with data and charts in an afternoon instead of a week.”

– Melody Foster, VP of Marketing at Zephyr

Read story

“Everyone from reporters to producers to graphics people use Infogram to create charts and visualizations.”

– Matt Martel, Executive Editor at Fairfax Media

Read story

“We wanted to create good content in a nice visual way, with a lot of design – but fast! We started using Infogram because of that.”

– Wagner Faria de Oliveira, Researcher

Read story

“At GTB we pride ourselves on creating content which engages, so it’s critical we understand the impact of our work. With the simplicity of Infogram we can create reports with all the detail we need while being easy to read and quick to create.”

– Fabrizio Rinaldi, Social Media Director

Read story

“Our researchers are very data driven but also visual. With Infogram, for each finding and dataset, we were able to quickly test different visualizations and then choose the best option. We were able to quickly in a very agile manner develop the look and feel of our graphs.”

– Andreas Oszkiel, Operations Manager

Read story

Used by many great companies, including: